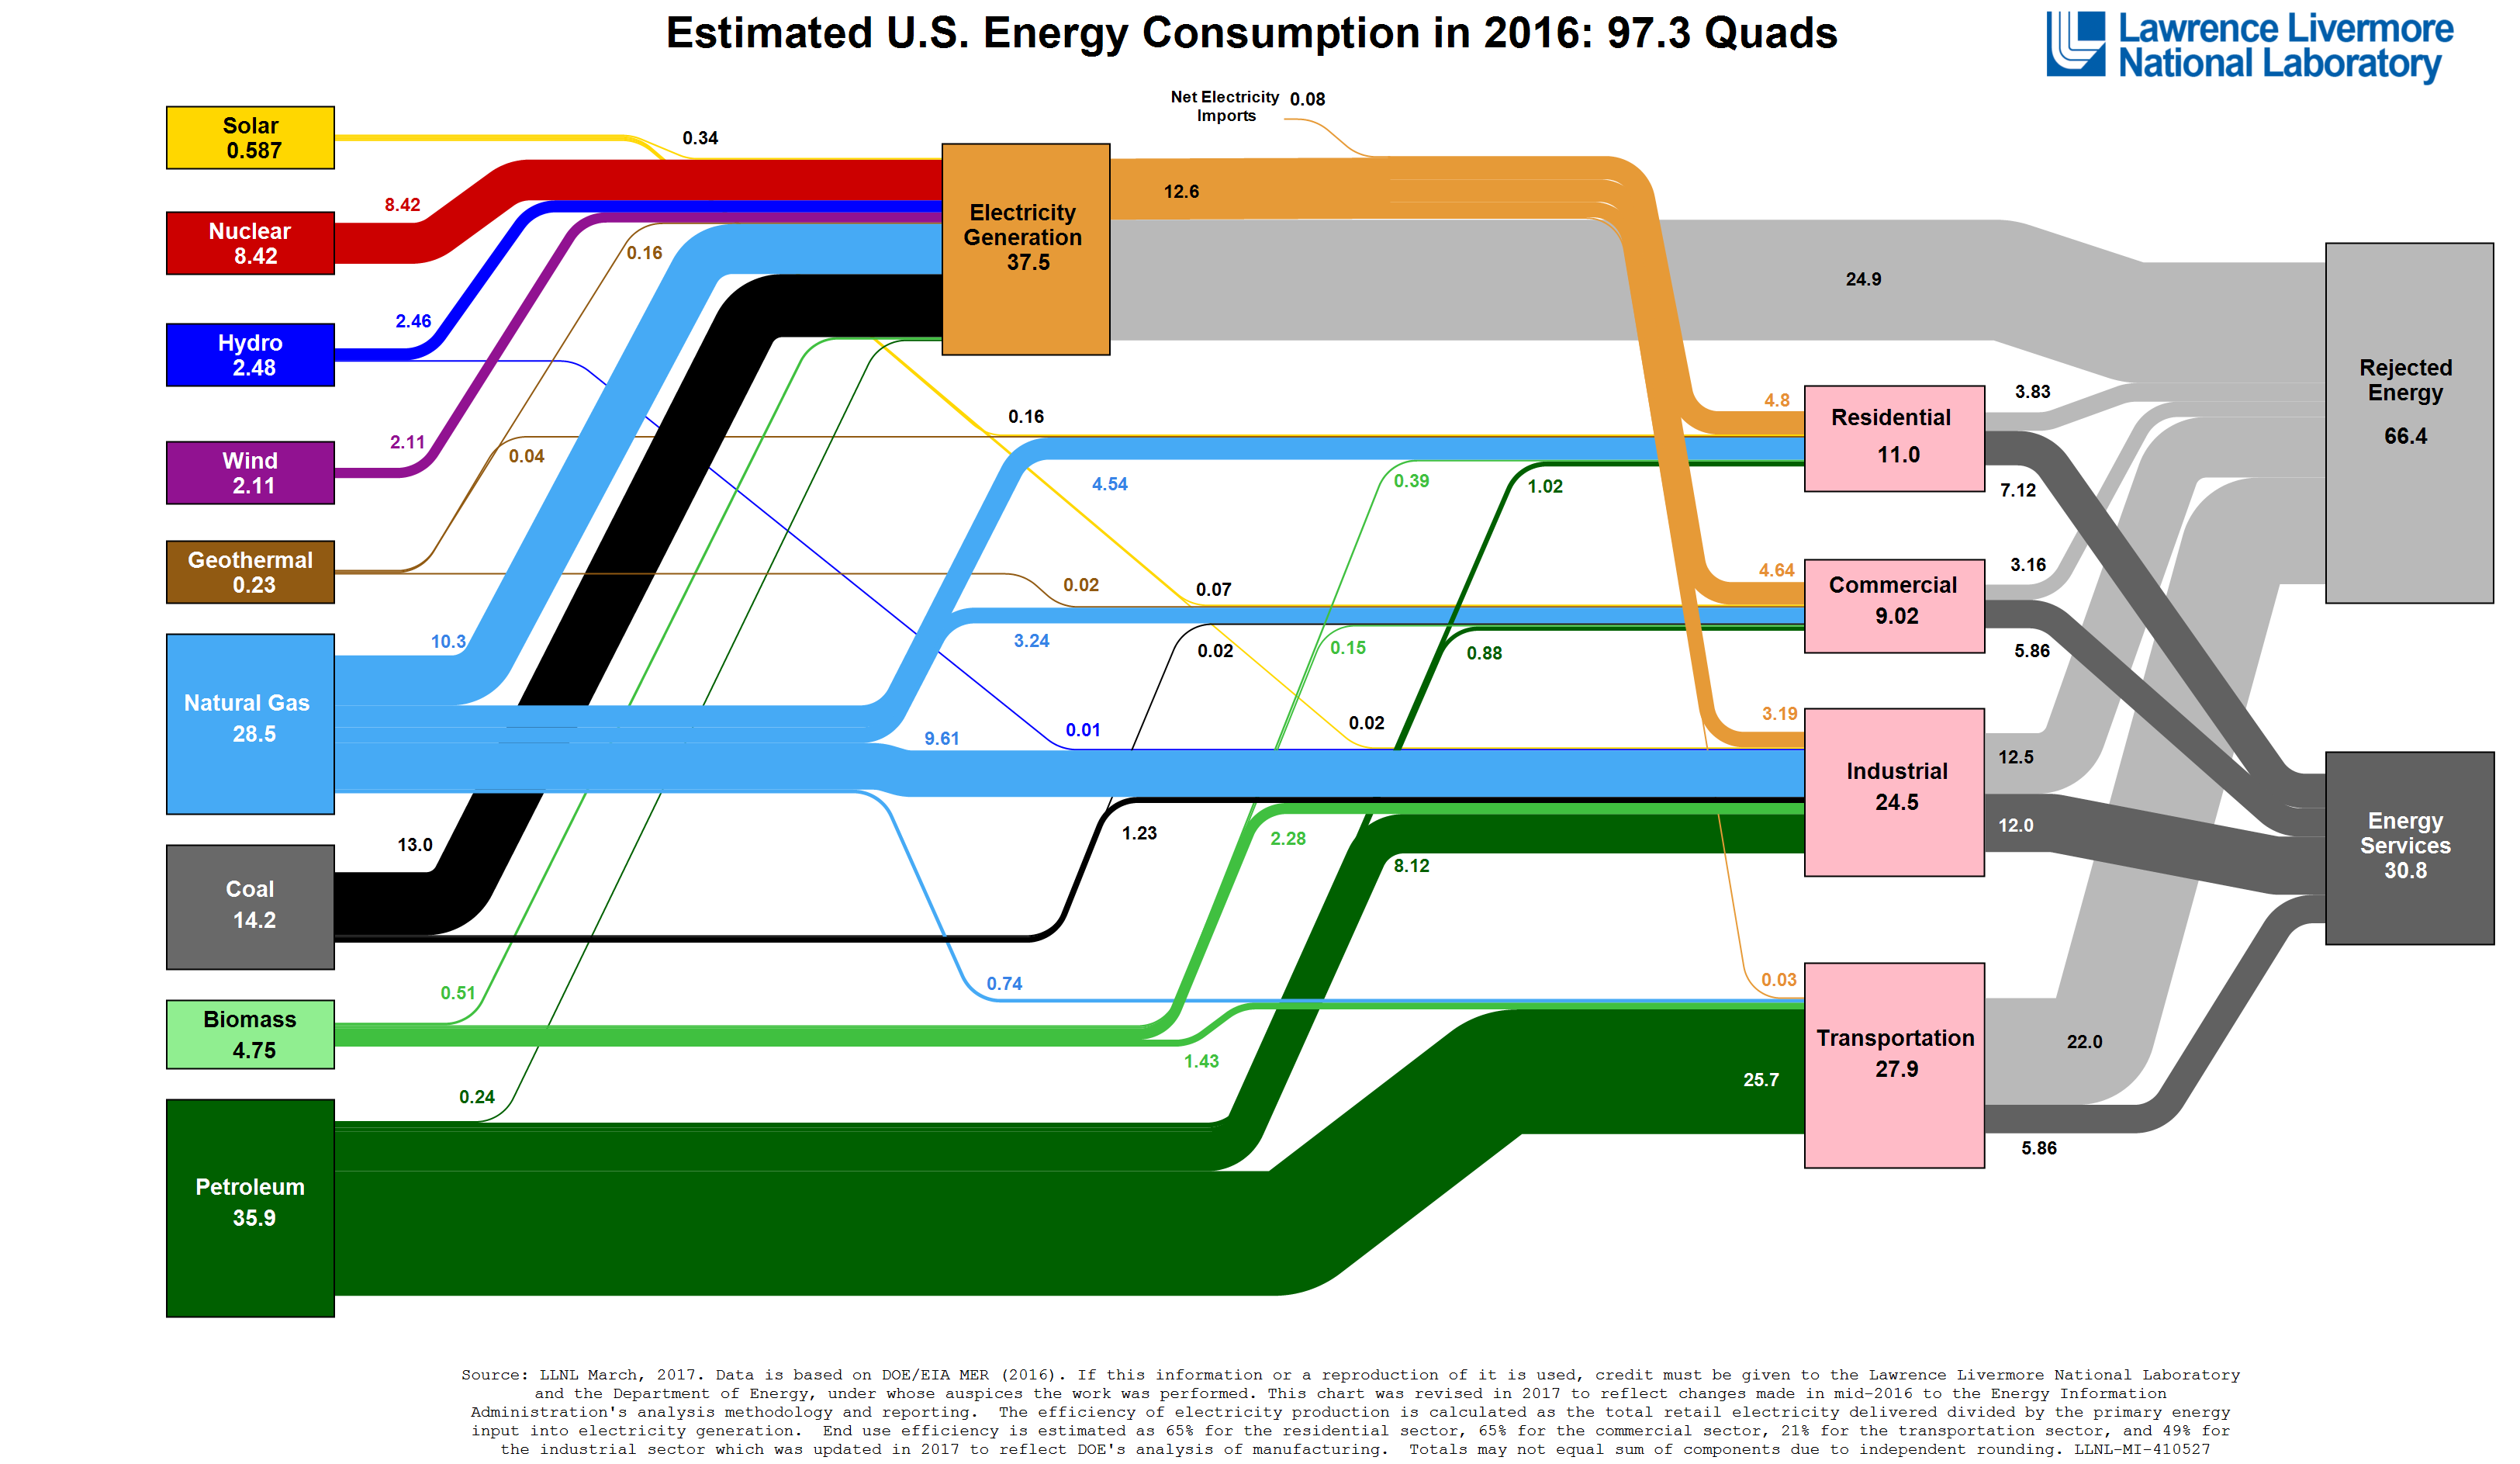
In 2016, the United States produced 97.3 quadrillion BTUs of energy. The only country to produce more energy each year is China (although they consume less per capita).
The diagram above, produced by Lawrence Liverpool National Laboratory (LLNL), details exactly how the U.S. both produces and consumes its energy. As you might imagine, our chief sources of power include oil, natural gas and coal. For example, the U.S. burned more than 35 quads of petroleum last year, most of which was converted to fuel for transportation. When it comes to powering homes and businesses, electricity is king and accounts for nearly 40% of the U.S.’s total energy consumption.
The LLNL diagram also details just how much energy is wasted each year. To understand this, start with the colored boxes on the far left. These indicate the total amount of raw energy sources consumed annually by the U.S. The pink boxes on the right break down how this energy is used via four categories: residential, commercial, industrial and transportation. The two gray boxes on the far right are perhaps the most important. The box marked “Energy Services” shows how much energy is converted to useful power. This means energy that keeps your lights on at home and moves your car when you drive. In 2016, this amounted to just over 30 quads. Remember – the U.S. produced 97.3 quads of total energy. So what happened to the other 67? They became waste, which is what the diagram denotes as “Rejected Energy”.
If you study the diagram, you’ll notice that most of the electricity in the U.S. is produced from coal, natural gas and nuclear resources. Yet of the 37.5 quads produced, only 12.6 was actually used to power homes, businesses and industries. The rest was lost during production and transportation. Watch the video below for a better understanding of how the U.S. consumes (and wastes) energy each year.
Thermolite is working hard to do our part in helping commercial buildings reduce their energy waste via high-performance interior window retrofits. According to the Department of Energy, buildings are responsible for about 40% of the primary energy consumption in the U.S., and 58% of a building’s energy is impacted by its windows. Traditional single pane windows – the most commonly installed window type in commercial buildings constructed in the 50s, 60s and 70s – are notoriously inefficient in terms of insulation.
Thermolite’s secondary window system provides a simple, cost-effective way for these types of buildings to upgrade their windows at a fraction of the cost of traditional replacement windows. The Thermolite system installs quickly and easily on the interior of a building’s existing windows. This not only minimizes installation time and costs, but also significantly reduces energy use and utility costs. For more information about how improving a building’s insulation will reduce its energy consumption – including a cost benefit analysis – read our blog about global consulting firm McKinsey & Company’s “A Cost Curve for Greenhouse Gas Reduction”.


